
Biomarkers of Diabetic Retinopathy


Abstract
Purpose
Diabetic retinopathy (DR) is the leading cause of visual impairment and preventable blindness and represents a significant socio-economic cost for health care systems worldwide. Vision loss related to DR is an important disability that threatens independence. Biomarkers have become the basis for preventive medicine, meaning medicine that recognizes diseases and takes specific measures to prevent the development of disease. They are also seen as the key to personalized medicine.
Settings
An integrated research (from ophthalmologist point of view) of most significant literature on imaging biomarkers related to an early and advanced stages of DR (including diabetic macular edema [DME] and proliferative DR) was performed.
Results
The systemic markers of diabetes such as duration of the disease, poor glycemic control, increased blood pressure, and lipid levels are relevant factors, but they do not identify DR worsening. It is well known fact that patients although under good metabolic control may worsen rapidly and develop advance form of DR while some other patients could escape vision loss even with poor metabolic control. Many new biomarkers are being developed that involve imaging technology. Microaneurysm turnover has been validated as a prognostic biomarker of development of clinically significant macular edema. Other good candidates for prognostic biomarkers of DR are subclinical macular edema, disorganization of the retinal inner layers (DRIL) and ellipsoid zone (EZ) identified by spectral domain optical coherence tomography.
Hemoglobin A1c remains the only confirmed systemic prognostic biomarkers of DR progression.
Conclusion
The availability of prognostic and predictive biomarkers of DR associated with generalized screening creates the conditions for preventive and personalized management of DR. Biomarkers can be used to diagnose disease risk, presence of the disease in an individual or to tailor treatment for the disease in an individual.
Tablet of Contents:
1. Introduction
2. Conclusion
1. Introduction
1.1 Diabetic retinopathy
Diabetic retinopathy (DR) is the leading cause of visual impairment and preventable blindness among working-age adults [1]. Vision loss related to DR is a significant disability that can lead to loss of independence, depression and reduced quality of life [2]. DR prevalence in the diabetic patients is about one-third, and 10% have vision-threatening form, such as diabetic macular edema (DME) or proliferative DR (PDR) [3]. In early stages, the only available treatments that physicians can offer are a good control of the risk factors for DR such as glycemic control and hypertension.
On the other hand, at advanced stages of the disease, the available treatments are laser photocoagulation, intravitreal injections of corticosteroids or anti-VEGF agents and vitreo-retinal surgery with significant adverse effects [4]. It is clear that patients under tight metabolic control may develop advance form of DR while some other patients could escape vision loss even with poor metabolic control. It is, therefore, very important to identify retinal lesions, their number and dynamics in the earlier stages of DR and correlate their occurrence to the worsening of any stage of DR to advance stages [5].
1.2 Biomarkers
The term ‘biomarker’ is a combination of ‘biological’ and ‘marker’ and has been used in clinical practice for many years [6]. They are referring to objective medical signs that can be measured and indicate the medical state of a patient, such as the severity of the pathology and often the prognosis of a disease [7]. There are two type of biomarkers: prognostic or disease- related and predictive or drug-related biomarkers [8]. Prognostic biomarkers indicate the progression of disease with or without treatment, whereas predictive ones help to estimate the most likely response to a specific treatment type. Biomarkers represent basis of personalized medicine, treatments individually adjusted to specific patients for highly efficient intervention in disease processes [9].
In this review, we will focus on potential biomarkers of DR progression and therapeutic response that may be used in clinical practice in order to implement a more personalized treatment.
1.3 Microaneurysms turnover
In the early stages of DR, the presence of microaneurysms (MAs) [10], but primarily its dynamics, increases the risk of DR worsening to more advance levels [11]. MAs appear and disappear in diabetic patients over time. Disappearing (capillary closure) of MAs is probably due to thrombosis of the vascular tree. This MAs turnover is a dynamic process and represent disease activity and has been suggested as a predictive factor for disease [12].
The automated computer-aided diagnostic system, RetmarkerDR (Critical Health SA, Coimbra, Portugal), was used to automatically detect MAs on the color fundus images. This system includes an algorithm that allows comparison within the same retinal location between different visits for the same eye. The algorithm computes for each eye the number of MA in each visit and the number of MA that appears and/or disappears from one visit to the other. The MA turnover is computed as the sum of the MA formation and disappearance rates [12]. Most studies showed that, even in the early stages of DR, there is an active MA turnover and that most MAs show a lifetime of less than 1 year, with rates of formation and disappearance varying between patients [13]. Cunha-Vaz et al., showed that in the initial stages of DR, higher MA turnover, obtained from color fundus photography, is a good indicator of retinopathy activity meaning the patients with a high MA turnover have a higher risk of developing clinically significant macular edema (CSME) compared to patients with lower MA turnover [14]. MA turnover is validated prognostic biomarker of progression of DR and diabetic macular edema (DME).
1.4 Subclinical macular edema
Measurement of retinal thickness by OCT is reliable and an increase in retinal thickness defines macular edema. OCT has provided clinicians to follow macular edema changes, and to detect increased retinal thickness even before clinical detection on slit-lamp. The term subclinical diabetic macular edema has been proposed to describe these early stages of macular edema [15].
The Diabetic Retinopathy Clinical Research Network (DRCR-net) set the definition of subclinical macular edema as an absence of edema involving the center of the fovea on slit-lamp examination, but a center point thickness measurement on Stratus OCT was of ≥225 µm and <299 µm [16]. There are few data in the literature regarding the natural history of subclinical macular edema. The Diabetic Retinopathy Clinical Research Network showed that one-quarter to one-half of these eyes will progress to CSME within 2 years of its identification [16]. Later, several independent studies confirm that subclinical macular edema in a diabetic patient is a good candidate for a prognostic biomarker for the development of clinically significant macular edema [17, 18]. Eyes/patients with subclinical DME presented a risk for DME progression 3.686 times higher than eyes/patients without subclinical, over a period of 2 years after its discovery. When subclinical DME is identified, treatment should involve more frequent monitoring of these patients in order to identify DME and to begin treatment on time [19].
1.5 Disorganization of the retinal inner layers (DRIL)
The identification of reliable biomarkers of visual acuity (VA) in patients with DME is of major significance. Commonly evaluated parameters such as glycemic control, retinopathy severity, presence and extent of retinal thickness are modestly associated with visual outcomes and inadequate predictors of VA in an individual eye [20]. The ability to determine which individuals will or will not respond to available treatments would assist therapeutic selection. Spectral domain optical coherence tomography (SDOCT) provides high-resolution, noninvasive visualization of the retinal architecture and is widely used to quantitatively evaluate retinal thickness. Although central retinal thickness is most commonly used in the evaluation and management of DME, central retinal thickness explains no more than 27% of the variation in VA [21].
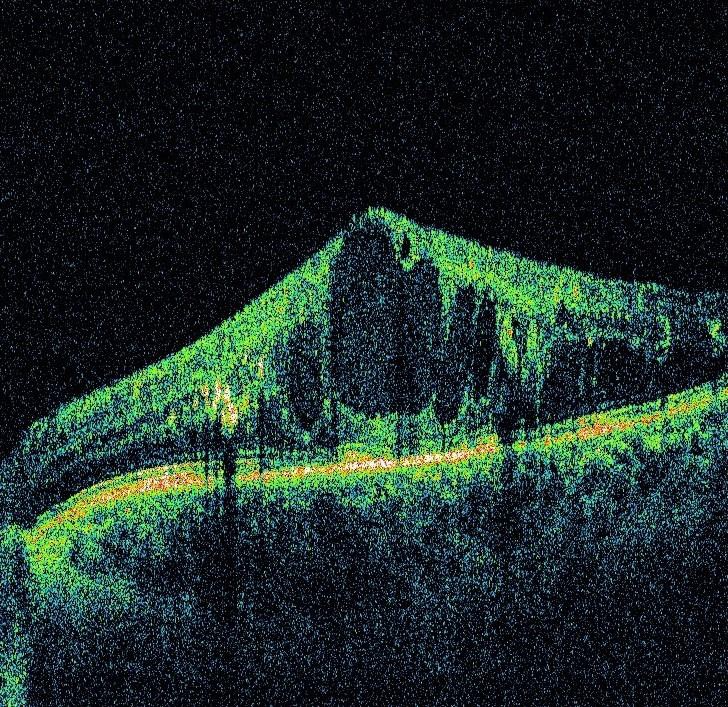
Other OCT-derived parameter evaluated as possible surrogate for VA is disorganization of the retinal inner layers (DRIL). A recent report from Sun et al., described an OCT feature termed disorganization of the retinal inner layers (DRIL) [20]. Disorganization of retinal inner layers is a structural biomarker that can predict the visual outcome of an existing or resorbed DME after treatment. Foveal DRIL was defined as the inability to distinguish boundaries between the ganglion cell, inner plexiform and nuclear and outer plexiform retinal layers in >50% of the foveal 1-mm zone (Fig. 1). Foveal DRIL could be present with or without DME, and loss of the normal macular contour did not constitute DRIL unless there was also loss of inner retinal layer boundaries [20].
According to Sun et al., on average, DRIL that affects 50% of the 1mm of central retina is associated with worse best corrected visual acuity (BCVA) in eyes with DME or after DME resorption meaning that after withdrawal of DME if DRIL exists, there will be no improvement in BCVA. Also, increase in DRIL during disease progression or/and treatment is associated with worsening of BCVA [20]. The causes of DRIL is not fully understood, but there are few explanations. Assumptions are that there is an anatomical break in the transmission of visual data from photoreceptors to retina ganglion cells. The inability to distinguish boundaries between inner retinal layers, may suggest destruction or disorganization of amacrine, bipolar, and/or horizontal cells located in these areas, that are necessary for the flow of visual impulses. Future investigations may more fully explain changes that accompany the appearance and disappearance of DRIL on SDOCT imaging [20, 22].
1.6 Retinal photoreceptor integrity
With the improved visualization of retinal architecture using SDOCT, many clinicians have used this tool to evaluate the effectiveness of various treatment options. Through studies and clinical experience, clinicians have found that some eyes with DME have poor visual outcomes despite complete resolution of edema [23]. The retinal photoreceptor layer can be assessed using SD-OCT by examining the integrity of the photoreceptor inner segment/outer segment (IS/OS) junction. Disruption of this second hyper-reflective line, that lies just above the retinal pigment epithelium (RPE), reveals damage to the photoreceptors. Formerly it was described as IS/OS photoreceptor junction but recent studies suggest it is photoreceptor inner segment ellipsoid (ISe) [24].
On the other hand, the external limiting membrane (ELM) separates the layers of rods and cones from the overlying outer nuclear layer and is a linear confluence of junctional complexes between Muller cells and photoreceptors [25]. Disruption of the ELM and the ISe was graded by SDOCT as follows: grade 0-no disruption of ELM and ISe; grade 1-ELM disrupted, ISe intact; grade 2-both ELM and ISe disrupted [26]. Evaluation of the EZ integrity is a measure of preservation and health of photoreceptor and it correlates with VA in patients with DME.
Assessing the status of EZ helps clinicians to predict the visual outcome more accurately: the shorter break in EZ integrity, there is a better VA in patients with DME. ISe and ELM are useful hallmarks for use in assessing photoreceptor layer integrity, and are closely associated with final VA in DME. Pretreatment VA and photoreceptor status can predict potential restoration of photoreceptor integrity and visual recovery in DME [27].
2. Conclusion
There is an increased interest in determining and validating non-invasive imaging retinal biomarkers in DR using different imaging devices such as photo fundus, SDOCT, Fundus autofluorescence and angio OCT. Biomarkers contribute to a better understanding of DR and create conditions for preventive and personalized treatment of DR.
The Authors:
KARADZIC J [1][2]
RISIMIC D [1][2]
JAKSIC J [1]
KOVACEVIC I [1][2]
JEREMIĆ M [1]
KALEZIC T [1][2]
KALEZIĆ B [1]
M. TRENKIC Bozinovic [3][4]
[1] University Eye clinic, Clinical Center of Serbia, Belgrade, Pasterova 2, (SERBIA).
[2] School of Medicine, University of Belgrade, Belgrade, (SERBIA).
[3] School of Medicine, University of Nis, Nis, (SERBIA).
[]4 University Eye clinic, Clinical Center Nis, Nis, (SERBIA).
Contributo selezionato da Filodiritto tra quelli pubblicati nei Proceedings “11th Conference of Ophthalmology with International Participation - 2019”
Per acquistare i Proceedings clicca qui.
Contribution selected by Filodiritto among those published in the Proceedings “11th Conference of Ophthalmology with International Participation - 2019”
To buy the Proceedings click here.
