
Interrelation of rotating agricultural lands with output indicators

Abstract
The purpose of the study was to identify and assess the interelation between the acreage dynamics, reflecting the removing of agricultural lands from rotation and their returning back, and production and economic indicators of agricultural producers. The data from the Federal State Statistics Service (Rosstat) were used as initial data. The dynamics of sown areas and other indicators related to changes in land resources and effective indicators of the agricultural sector were analysed for 72 territories of the Russian Federation. As a working hypothesis, the assumption was made that there is a significant interrelation between the dynamics of sown areas and production and economic indicators of agricultural producers. The analysis of the dynamics of sown areas, including the areas under grain and leguminous crops, in regions of the Russian Federation, as well as the dynamics of the structure of sowings of main agricultural crops, showed the presence of significant shifts both in size and in the structure of areas. It was found that productive indicators of agricultural production, in particular, crop yields, profitability of the crop industry, net financial result (profit minus loss) of the crop industry in the regions correlate with indicators reflecting the regions’ share in the total size of sown areas and dynamics. Economically acreage growing is due to the increased profitability of crop production in 51 out of 71 regions. The acreage growth is accompanied by an increase in yield, and, moreover, the yield is higher in regions with large production volumes. The growth of acreage leads to improved financial results of enterprises and land productivity (defined as the ratio of the balanced financial result of the crop industry and the sown area). During 2005-2016 the increase in land productivity was observed in 52 out of 72 regions.
Table of Contents:
1. Introduction
2. Literature Review
3. Methodology
4. Empirical Findings
5. Conclusions
1. Introduction
One of the main arguments in favor of removing lands from agricultural use is their fertility diminishing as a result of excessively intensive usage. Thus, the balance of nutrients in the soil is reduced, and, in order to avoid its further degradation, it is advisable to stop its using.
Thus, by 2017, the amount of fertilizers used per hectare of sown land has decreased by 10 times against 1990. The balance of nutrients in the soil of Chelyabinsk region since 1990 is negative. In 2017, it amounted to 131.3 thous. tons of active ingredients or 69.0 kg/ha of acreage (Zybalov, Denisov, 2018), which may be the reason for removing some lands from agricultural use.
On the other hand, when fallow lands are not used and other conditions are equal, either the load on the lands remaining in rotation increases or the production decreases. Negative consequences can be avoided by improving technology, increasing the balance of nutrients.
According to the results of studies conducted in 2003-2010 in the southern forest steppe on the experimental field of the instructional farm of Verkhneuralsk agrarian vocational school n.133, it was established that the agrophysical properties of chernozem being fallow for five and eight years were improved. The content of organic matter increased, the biological activity of soil improved, which made it possible to use fallow lands in agriculture after their due treatment and applied fertilizers, ameliorants, adsorbents (Zybalov et al., 2016).
On the 1st of January 2018 the area of unused lands in Chelyabinsk region was 24.6%, 723.2 ha of lands that had been in rotation before were not used. Only since 2016, a weak tendency to reduce the area of fallow lands can be noticed (Fig. 1).
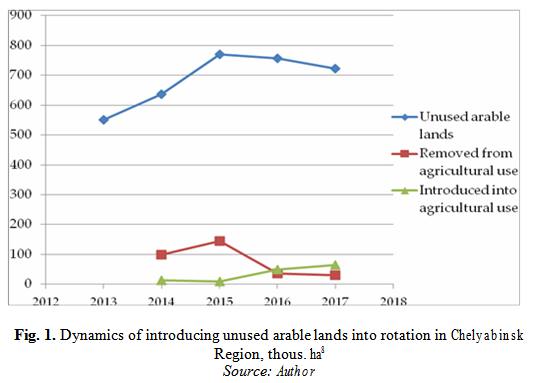
The dynamics of the area of fallow lands in Chelyabinsk Region during 2013-2017 does not make it possible to draw some firm conclusion about the tendencies, but the distribution of fallow lands becomes less uneven against the total arable land area. In particular, the variation coefficient of the share of fallow lands in the total acreage for the areas of the region decreased from 0.90 to 0.749.
Thus, to find the economic causes or consequences of the returning of fallow lands into rotation is of great interest. It was done based on data characterizing the main agrarian regions of Russia.
2. Literature Review
This article considers only the production criterion for assessing the need for acreage growth. But this is only one of several possible criteria, their detailed analysis being given in scientific works (Pullin et al. (2016)), Esmail, Geneletti (2018)). Currently, the attempts to expand agricultural lands can difficult because of urbanization processes leading to land redistribution, and not always in favor of agriculture (Schwaab et al., 2018, FAO & ITPS, 2015, Afifi et al., 2013). Therefore, the involving of agricultural lands in rotation can be one of possible ways for retaining them for production, since useless lands may be removed from agricultural use, transferred into another land category to be permanently lost for the agricultural sector of the economy.
3. Methodology
The assumption that there is a significant relationship between the acreage dynamics, production and economic indicators of agricultural producers was considered as a working hypothesis. Since the removal of land from agricultural use is often believed to be due to unproductive and unprofitable cultivation (EEA, 2005, Westhoek et al., 2013), according to changes in the acreage dynamics, the crisis in domestic agriculture can be thought to be overcome or not.
To support the hypothesis, the following tasks are sequentially solved.
1. Both the acreage dynamics including the areas occupied by grain and leguminous crops for the regions of the Russian Federation and the dynamics of the structure of main crops are analysed.
2. The indicators of agricultural production and crop yields, the profitability and balanced financial result (profit minus loss) of the crop industry for the regions of Russia are analysed.
3. The presence and significance of the correlation relationship between the analyzed indicators is found.
Materials and research methods. The data from the Federal State Statistics Service (Rosstat) were used as initial. The acreage dynamics, other indicators related to changes in land resources and effective indicators of the agricultural sector were analysed for 72 territories. The following non-cereal regions were excluded from the general coverage: Kamchatka Region, Karelia, Nenets Autonomous Okrug, Khanty-Mansi Autonomous Okrug, Yamalo-Nenets Autonomous Okrug, Sakhalin
Region, Magadan Region, Chukotka Autonomous Okrug, as well as cities of federal significance and the Republic of Crimea, the latter being to ensure data comparability over the entire analyzed time interval. In 2017 the excluded regions produced less than 2.2% of the total crop production in Russia. The processing of statistical data included calculations of descriptive statistics indicators: average, maximum and minimum values of indicators, standard deviations, variation coefficients. Dynamics of indicators was estimated by the index method. The interrelation of indicators was estimated according to the results of correlation analysis, the significance of correlation coefficients being found with the help of Student’s test.
Effective indicators of agricultural production were estimated by production and financial results (yield, profitability), the data were compared due to the introduced indicator of land productivity equal to the ratio of the balanced financial result of the crop industry and the acreage.
4. Empirical Findings
During 2006-2016 the area under crops in farms of all categories increased in Russia from 75,837 thous. ha to 79,993 thous. ha or by 5.5%. At the same time, there was a uniform tendency towards increasing in acreage in the regions of Russia. Acreage decreasing in the North-West and Siberian Federal Districts may be due to relatively unfavorable climatic conditions, with the result that the products of these regions are less competitive on the Russian market. In the Siberian Federal District, the increase in acreage was observed in the regions most favorable for production: Altai Territory, the Altai Republic, Khakassia and Omsk Region; in other regions there was an acreage reduction. In the North- West Federal District, the area under crops increased only in Kaliningrad and Novgorod regions. The data on the increase of the acreage compared with the area under grain crops reveal a more intensive dynamics and a greater varation of the values showing the increase of the latter. The data are shown in Table 1.
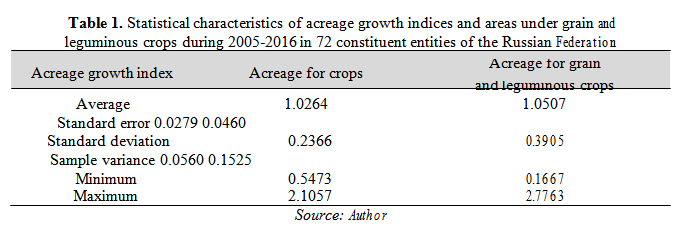
In general, the areas under grain and leguminous crops increased more noticeably, although the data on their dynamics in the regions vary widely in comparison with the total acreage.
Yield fluctuations of most crops are quite intense over the years (Table 2). The analysis of the data of yields during 1991-2017 proved an increase to be observed for most crops. To even out the effect of the weather factor and to match time intervals, the data for the successive decades during 1998-2007 and 2008-2017 were compared (the data are shown in the lower part of Table 2).
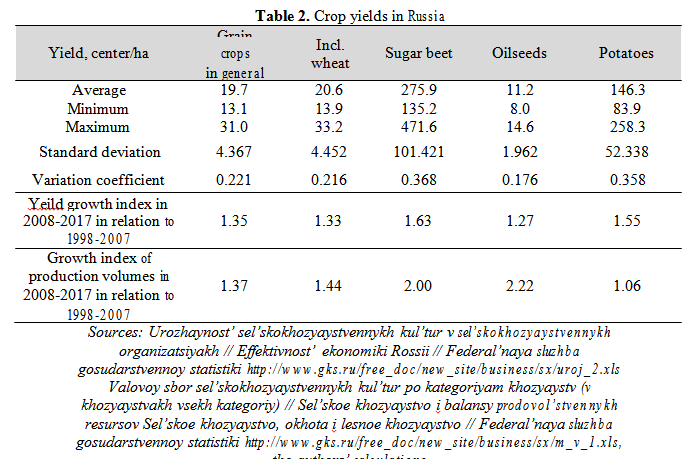
The table does not include the data on fodder crops; the dynamics of their yield is not so noticeable: the increase for different types of products over 10 years was from 1 to 12%.
With an increase in the average yield and acreage, the production of agricultural products will raise in general (the data on growth indices of production volumes during 2008-2017 against 1998-2007 are presented in the last line of Table 2). However, the analysis of the data on the gross crop yield [3] shows that there is an uneven growth in production in general. This may indicate both a structure redistribution of crops and an uneven change in the structure of production in the regions.
The analysis of the acreage structure according to the types of crops in Russia as a whole [4] proves the changes to be uneven (Table 3).
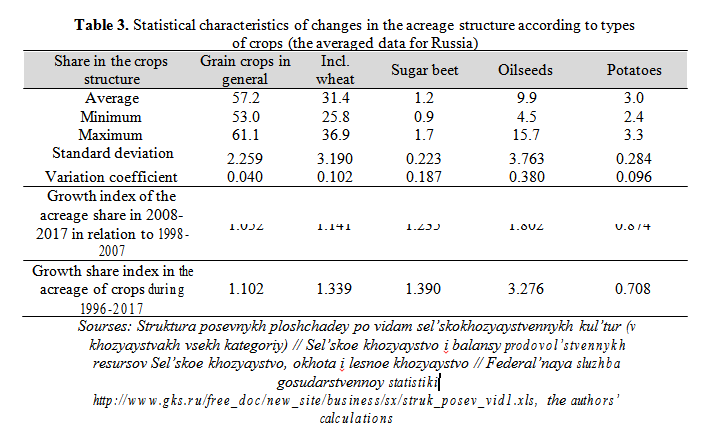
Moreover, long-term changes are even more significant (when the data compared for 10 years and 22 years) for all types of analyzed crops. This proves the fact that over time there occurs not just an increase in the area, but some redistribution in favor of some crops against others.
Changes in the crop production structure in regions and their rationality can be confirmed by analyzing the data on the financial results of agricultural organizations. If changes in financial results (balanced financial result, i.e. profit minus loss, profitability level) are more significant than changes in resource provision (land resources), then the involvement of lands in agriculture may be due to economic reasons.
In general, for the most of analyzed regions (for 57 out of 72), positive average values of crop production profitability were observed. In 51 out of 71 regions, the profitability increased in 2016 against 2005. This may favor the economic justification for the acreage growth, since along with the general tendency of increasing, the profitability of crop production raises. The positive balanced financial result of the crop industry can serve as an indirect confirmation of this thesis, as during the analyzed period it was observed in most of the regions. The number of profitable regions varied from 43 in 2010 to 55 in 2016.
To identify the nature of the interrelation between the analyzed indicators, a correlation matrix was compiled (Table 4). The data on the structure of crop production in the regions of Russia are taken from [1].
The pair correlation coefficients were calculated according to the formula:

where xjk is the value of the jth and kth indicators ![]() for the ith region, is the average value of the indicator.
for the ith region, is the average value of the indicator.
The names of the indicators are given in Table 4. The significance of the indicator rjk was determined with Student’s test for n = 72.
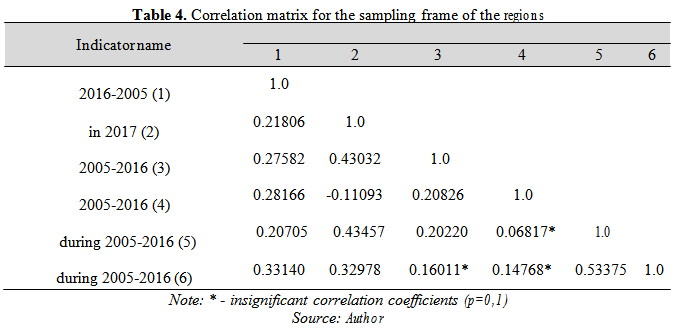
The positive correlation between the analyzed indicators makes it possible to conclude that the acreage growth in the regions is due to production efficiency. The low significance of the correlation coefficients of financial indicators with the yield (relative values characterizing the changes over time) may be due to unfavorable market conditions, namely the financial gain caused by the yield increase may be even out by a decrease in market prices. However, this thesis requires further substantiated verification.
With an exception being the negative value of the pair correlation coefficient of the region’s share in the crop production in 2017 and the increase in yield of grain crops during 2005-2016, it can be due to a more intensive increase in yield in the regions with lower production before.
The acreage growth is accompanied by yield increasing; moreover, the yield is higher in the regions with large production output. The acreage growth leads to improving financial results of plant growing producers.
Land productivity also increases: this indicator was found as the ratio of the balanced financial result of the crop industry and the acreage. The increase in land productivity during 2005-2016 was observed in 52 out of 72 regions.
5. Conclusions
For the analyzed time period 2005-2016 in most regions of Russia there was a moderate increase in acreage. The growth rate of acreage under grain and leguminous crops doubled the growth rate of acreage under agricultural crops in general. This growth was accompanied by an increase in the yield of main agricultural crops, which ultimately led to an increase in production output in the agricultural sector of Russia. Thus, Russia’s agricultural industry can be assumed to overcome the crisis of the 1990s and to be in the recovery stage.
For most regions, positive changes in the structure of production along with the extensive use of land resources have led to improved financial performance in production, i.e. the balanced financial result and profitability of crop production.
Thus, the hypothesis about the existing positive correlation between the indicators of the acreage dynamics, production and economic indicators of agricultural producers is confirmed.
The shifts in the dynamics of fallow lands in Chelyabinsk region generally agree with the all-Russian tendency. Thus, involving fallow lands in agriculture can be considerd as feasible according to the potential economic result due to increasing acreage. This result, however, requires the forecast of market prices for the main types of agricultural products, as well as considering the planned regulatory measures by the state.
8 According to the Federal State Budgetary Institution “Center for Chemicalization and Agricultural Radiology”, Chelyabinsky.
9 The authors’ calculations according to the information of the Federal State Budgetary Institution “Center for Chemicalization and Agricultural Radiology”, Chelyabinsky.
The authors:
KOPCHENOV Alexei Aleksandrovich [1][2]
ZYBALOV Vladimir Stepanovich [3]
[1] South Ural State Agrarian University, Troitsk, the Russian Federation (RUSSIA).
[2] Financial University under the Government of the Russian Federation, Chelyabinsk, the Russian Federation (RUSSIA).
[3] South Ural State Agrarian University, Troitsk, the Russian Federation (RUSSIA).
Contributo selezionato da Filodiritto tra quelli pubblicati nei Proceedings “Ecological Agriculture and Sustainable Development - 2019”
Per acquistare i Proceedings clicca qui.
Contribution selected by Filodiritto among those published in the Proceedings “Ecological Agriculture and Sustainable Development - 2019”
To buy the Proceedings click here.
