
Progressive Taxation and Economic Growth


Abstract
“Liberté, égalité, fiscalité” was and is still considered a motto of the conception of the economic and fiscal environment in France. This was also the subtitle of Michael Kwass’s book “Privilege and the politics of taxation in eighteenth-century France”, which offers a lucid interpretation of the most ambitious plan of the 18th century French monarchy, namely the attempt to impose direct taxes to the privileged elites which were formerly exempt. It is well known that France has a rich history that extends to the level of taxation. Being a country with a rather tumultuous fiscal stance throughout its history, France offers a wide range of study themes in this field. This paper aims to analyse the fiscal framework in France and to identify the links between certain fiscal variables and the economic growth of the country. Thus, the impact of certain fiscal components on the economic growth of France (highlighted by the GDP growth rate) is analysed by elaborating descriptive graphical analyses, as well as by elaborating an econometric model (using the multiple regression analysis). The analyses will show the importance and the significant influence of the fiscal variables included on the French economy and the results of the econometric model will highlight the negative relations between GDP growth rate and taxes on wages and VAT, respectively the positive relationship between GDP growth rate and taxes on corporates. In this sense, the analyses performed provide an overview of the relationships between the mentioned fiscal variables in case of France and may also constitute points of interest in the event of expanding and elaborating a more advanced statistical/econometric model.
Table of content
1. Introduction
2. Problem Statement
3. Research Questions/Aims of the research
4. Research Methods
4.1 Descriptive statistics and econometric model
4.2 Data on the current tax system in France
5. Findings
5.1 The current tax system in France
5.2 Evolution of the taxation and economic growth in France
5.3 Econometric analysis
6. Conclusions
1. Introduction
Given the fact that the global economy is in a continuous process of expansion and diversification, taxation and its effects have been a subject of maximum interest lately among practitioners (public or private) and academics.
Each country, whether we refer to EU countries or non-EU countries, has the possibility to build its own fiscal system. But, given the fact that many countries are currently facing budgetary instability mainly due to the fiscal policy, they have to find a way to establish tax systems so as to generate optimal economic development and, at the same time, to generate budgetary stability.
As already mentioned, France is a landmark in the field of taxation and with all adjustments and updates to the economic realities of the times, the French tax system is an historical survival. In its more recent form, the French model was adopted in most developed countries.
Through an extensive and critical description of income taxation history in France from the early 18th century to the end of the 19th century, Willis (1895) demonstrates that this history is “almost unique”, showing the strange fact that France was somehow conservative in taxation, since radical political changes adopted on fast forward are not in the benefit of fiscal and economic progress.
Therefore, one can easily deduct that France is one of the most advanced state in the field of taxation and may represent a study base for many researchers.
This paper aims to achieve three main objectives. Firstly, a relevant and precise synthesis of the specialized literature will be performed followed by a brief graphical analysis of the fiscal/economic components below. Further, we aim to elaborate a basic econometric model using as dependent variable the GDP growth rate (reflecting the general economic growth) and as independent variables corporate taxes, taxes on payroll and workforce and VAT registered by the French Government during the period 1965-2015 based on the data provided by the OECD public database.
2. Problem Statement
The French tax system was by no means a uniform one, and throughout history there was diversity in terms of collection and collectors (the church, the lords or the state), taxable base or related rates.
Starting from the oldest tax imposed by the French monarchy “taille” from the “Ancien Régime” (French Old Regime from the 14th century), advancing to “dixième”, “vingtième” and to the French Revolution of 1789, the major experiments of the French tax system stop by the 20th century, when the current system began to be drawn. As regards the old types of taxation, Willis (1895) stated: “For a long time anterior to the Revolution of 1789, the impost called the dixième which by a later evolution became the vingtième, had clearly recognized the income tax as a legitimate fiscal resource”.
Analysing the origins of the French Revolution, Kwass (2000) examines the biggest change envisaged by the French monarchy in the 18th century to extend the application of direct taxes on privileged classes as well. He describes how the monarchy has redefined its institutions and ideology to impose new forms of taxation on privileged classes and demonstrates that this move not only changed the relationship between the monarchy and society at that time, but also transformed the political thinking into the period before the French Revolution.
Another very important element to mention is that Value Added Tax (“VAT”) is a genuine French idea. Therefore, we can observe the major impact of fiscal policy in the history of France. This brief review of the long history of the French tax system is needed to better understand the bases and experience behind the creation of the current system.
The effects of fiscal components on economic growth or on various economic/financial indicators are a predominant subject for researchers lately. Below we made a selection of several studies relevant to the chosen topic.
Cardia et al., (2003) examined the empirical effects of discretionary taxation on labour supply in several countries and found in the United States (“US”) that a 10 percentage points (“p.p.”) decrease in tax rates could lead to an increase 18% in weekly working hours. Through certain regression analysis, Çela (2017) demonstrates that in Albania (a country with weak legal infrastructures) the profit tax has a strong negative correlation and impact with FDI inflows.
As for the relationships between taxation and economic growth, several authors have turned their attention to this issue, a lot of analyses being conducted for several countries. Since the 1950s, authors such as Bloom (1955), Thompson and Mattila (1959) have not identified any link between taxes and economic growth, these results have extended to the late 1980s – Carlton (1979). But, after this period, the analyses began to show different results. Thus, Helms (1985) examined the effects of state and local taxes on economic growth using time series for the period 1965-1979 of cross sections of 48 countries and found a significant negative impact of these taxes on economic growth. Burgess and Stern (1993) found that between tax rate and GDP per capita is a certain correlation in case of developing countries, but not in case of industrial countries.
By applying the regression technique for the period 1990-2007, Braşoveanu and Obreja (2008) concluded that in Romania the distortionary taxes (containing personal income taxes, corporate income taxes, social security contributions, property taxes) and nondistortionary taxes (VAT and excise duties) have negative effects on economic growth.
Romer and Romer (2010) investigated the impact of tax changes on economic activity. The obtained results showed that 1% increase in the tax burden in GDP has the effect of decreasing the real GDP by about 3%.
Kalaš et al., (2017) highlight that tax revenue growth and social security contributions have a significant impact on the economic growth. The results of their analysis for the United States shows that 1% increase in tax revenue growth and social security contributions leads to an increase of GDP of 0.3% and 2.05%.
Many related studies were performed at the level of Nigeria. Thus, Chikezie et al., (2017) have recently shown that tax revenue, external borrowings, government domestic debt and government capital expenditure have not contributed significantly to economic growth and poverty reduction in Nigeria, while Arowoshegbe et al., (2017) indicated that tax revenue from Petroleum Profit and Company Income have a positive and significant effect on economic growth, while revenues from Value Added tax and Education tax have no significant effect on economic growth of Nigeria. Nálepová (2017) also shows that mainly income taxes have negative impact on economic growth at the level of OECD countries.
However, in the case of France, studies in this field are relatively old, an updated analysis to the current economic realities is needed to provide an overview of what represents the fiscal dimension in the economic environment in France and perhaps even to extend this dimension to other states. Thus, this article highlights the overall picture of French taxation and can be a solid basis for possible further analysis in this field.
3. Research Questions/Aims of the research
Given the objectives mentioned above, through this paper, we contribute to the existent literature/knowledge by performing several analyses, based on latest statistical data available, for a country which is perceived as a model in the field of taxation. Further, our contribution complements a series of similar analyses (for other countries) and the results allow a comparison with other tax systems.
4. Research Methods
4.1 Descriptive statistics and econometric model
In order to achieve a brief graphical analysis of the evolution of certain fiscal indicators, as well as the economic growth, but also for the elaboration of an econometric model, we used the data provided on the OECD website through its statistical tool. Thus, the analyses were based on the following indicators registered for the period 1965-2015:
• GDP growth rate (defined in the following as “GDPgr”): expressed in annual growth rates in percentage and based on the calculation of GDP through the expenditure approach;
• Tax on profits of corporates (defined in the following as “CIT”): in millions EUR and which includes mainly corporations’ tax (excluding tax credits or remove the taxation), tax on dividends, tax on financial assets and other related components;
• Taxes on payroll and workforce (defined in the following as “TPW”): in millions EUR
and including in principal tax on wages;
• VAT: in millions EUR.
Further, the econometric tools were used through the Eviews 7 software and a multiple regression model was analysed using the data mentioned above.
4.2 Data on the current tax system in France
In order to highlight an overview on current methodologies and rates of taxation in France, we used various reports issued by the consultancy firm EY (available on its website).
5. Findings
In the following, we present the related results in a structured manner.
5.1 The current tax system in France
In this chapter, starting from the data provided by the reports issued by EY (2017), we will review the current fiscal system in terms of personal income tax, corporate income tax and VAT.
Personal income tax: Taxable income is represented by annual disposable income from all sources (e.g. taxable salary income, self-employment and business income etc.). After identifying the income, certain allowances, deductions and treaty provisions are applied in order to establish the net taxable income, which is further subject to progressive tax rates (EY, 2017).
For 2016, the following table provides the annual taxable income intervals and related tax rates applicable.
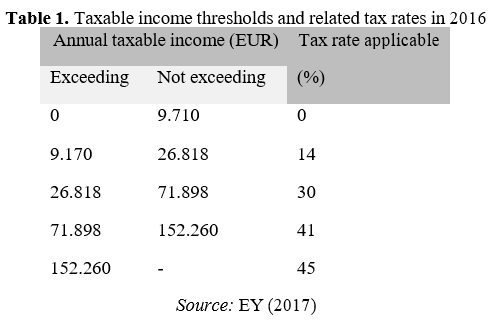
Exceptional 3% and 4% tax on high income taxpayers (for the portion exceeding 250.000 EUR, respectively 500.000 EUR).
Corporate income tax: The standard corporate tax rate in France is 33.33%. A social security surtax of 3.3% is assessed on the portion of corporate tax due exceeding 763.000 after offsetting the tax credits (EY, 2017).
VAT: The VAT standard rate in France is of 20% and there are certain VAT reduced rates:
2.1% (for pharmaceuticals), 5.5% (for foodstuffs) and 10% (for accommodation). There is no threshold for VAT registration in France (EY, 2017).
5.2 Evolution of the taxation and economic growth in France
In the following we will observe the evolution of the indicators subject to this paper and what were the possible causes that led to these results.
Thus, in Figure 1 below, we notice a continuously positive evolution only in case of TPW, while CIT and VAT have much more pronounced evolutions, but with decrease periods. A drastic decrease is observed for CIT in 2009. Moreover, in the same year, VAT also registered a decrease, but at a lower level. Therefore, we can deduce that consumption decreased in a more moderate manner compared to profits registered by the French companies.
One fact may be unusual: that TPW growth has continued even in time of crisis.
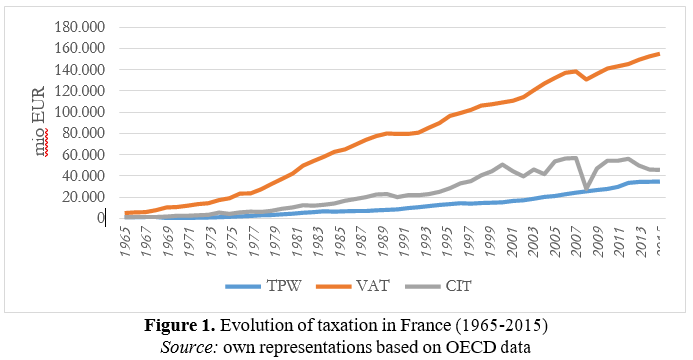
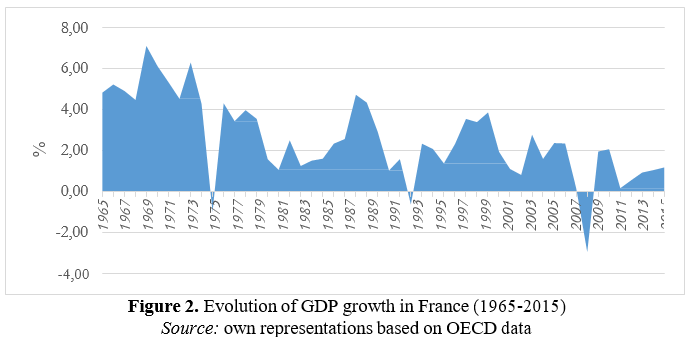
Figure 2 below outlines the evolution of economic growth through the GDP growth rate. Thus, we can see three dropping peaks: 1975, 1993 and 2009.
It can be argued that the fall of 1975 is based on the oil crisis of the 1970s and the fall of Bretton Woods system, during which France recorded a major fall in industrial production and fiscal and budgetary measures of that period created a considerable budget deficit. As for the 1993 fall, this period meant an economic contraction for France when unemployment reached historical levels. An anomaly for this period is represented by the fact that, although unemployment was on the rise, the TPW did not fall.
Evolutions of fiscal indicators (excepting the TPW) and GDP growth have the same trend during the crisis period started in 2008.
5.3 Econometric analysis
For testing the impact of fiscal policy on economic growth, Barro and Sala-i-Martin (1995) suggest that a better analysis may be performed by separating the categories of budgetary revenues. In this regard, in the composition of the econometric model we chose the variables mentioned above and we proceeded to logarithm independent variables in order to obtain a more relevant output. Thus, the equation of the model from which we started is presented below:
GDPgr = β0 + β1 x log(CIT) + β2 x log(TPW) + β3 x log(VAT) (1) The output of the equation (1) is shown in Table 2 below
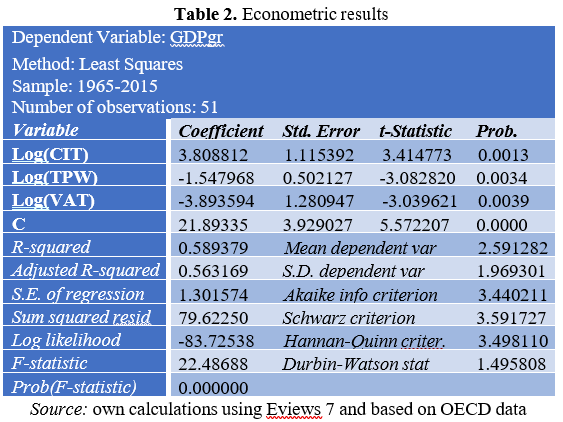
We note that the output records R-squared and Adjusted R-squared values of 0.58 and 0.56. This shows that the independent variables included in the model explain in proportion of over 50% the dependent variable GDPgr.
In terms of parameter testing, we note that all variables included record values of Prob. lower than 0.05 (5%), so we can argue that all the variables included in the model significantly influence the dependent variable (GDPgr).
Furthermore, in order to test the model as a whole, since Prob (F-statistic) is 0, lower than
5% (0.05) and F-statistic is 22.48, higher than F critical, we have the arguments to sustain that the regression model is valid.
Based on the above results, the equation of the model becomes:
GDPgr = 21.89 + 3.80 x CIT – 1.54 x TPW – 3.89 x VAT (2)
In terms of economic interpretation, the econometric model obtained tells us that, in terms of direct taxation, an increase of 1% of CIT determines an increase of 3.80 p.p. of GDPgr, while an increase of 1% of TPW determines a decrease of 1.54 p.p. of GDPgr. In terms of indirect taxation, an increase of 1% of VAT leads to a decrease of 3.89 p.p. of GDPgr. For each variable, the interpretation is valid given that all other variables included remain constant.
The positive relation between CIT and GDPgr can be explained economically by the fact that French companies with higher profits contribute to the economic growth of the country.
The relation between TPW and GDPgr could be interpreted in the light of the fact that when labor supply experiences higher fiscal pressure, the economy is affected in a negative manner.
The negative influence of VAT increase on economic growth may indicate that the economy of France is not necessarily based on consumption. More specifically, in case of France, the idea that when consumption increases, the economy follows the same trend is not necessary valid. Thus, we can say that, according to the results, the economy of France is not consumption-based, which can reveal at first glance a greater economic stability compared to economies that are strongly influenced by consumption.
6. Conclusions
The analyses performed within this paper showed us that the fiscal elements such as CIT, TPW and VAT have a significant influence on the economic growth in France, a country that has a unique history in terms of taxation.
Throughout the econometric analysis, we have concluded that TPW and VAT have a negative influence on GDPgr, while the CIT has a positive influence on GDPgr.
Even though the R-squared and Adjusted R-squared indicators may be interpreted by some specialists as not having sufficient values so that the model is considered 100% viable, this relatively low value can be justified by the fact that the evolution of a country’s GDP is influenced by a multitude of variables that can be hardly integrated into an econometric model.
The model performed in this paper has strictly targeted the influence of taxation on economic growth and the economic interpretation mentioned above confirms that the results of the model are based on economic reasoning.
Notes
[1] The Bucharest University of Economic Studies, Bucharest, Romania.
[2] The Bucharest University of Economic Studies, Bucharest, Romania.
* Corresponding author.
References
[1] Arowoshegbe, A. O., Uniamikogbo, E., Aigienohuwa, O. O. (2017). Tax Revenue and Economic Growth of Nigeria. Scholars Journal of Economics, Business and Management, 4(10), pp. 696-702. [2] Barro, R., Sala-i-Martin, X. (1995). Economic Growth, McGraw-Hill, Inc.
[3] Bloom, C. C. (1955). State and Local Tax Differentials and the Location of Manufacturing. Bureau of Business and Economic Research.
[4] Burgess, R., Stern, N. (1993). Taxation and Development, Journal of Economic Literature, 31(2), pp. 762-830. [5] Cardia, E., Kozhaya, N., Ruge-Murcia, F. (2003). Distortionary Taxation and Labour Supply, Journal of Money, Credit, and Banking, 35 (3), pp. 350-73.
[6] Carlton, D. W. (1979). Why new firms locate where they do: An econometric model Interregional Movements and Regional Growth. The Urban Institute.
[7] Çela, S. (2017). The Effect of Corporate Profit Tax on Attracting Foreign Direct Investment in Albania. International Journal of Financial Research, 8(2), pp. 186-193.
[8] Chikezie, K. A., Uchechukwu Joe, O. J., Boloupremo, T. (2017). Fiscal Policy and the Nigerian Economy: An Econometric Review. International Journal of Business and Management, 12(4), pp. 186-196.
[9] EY. (2017). Worldwide Corporate Tax Guide 2017 (pp. 479-501). Retrieved from http://www.ey.com/gl/en/services/tax/global-tax-guide-archive
[10] EY. (2017). Worldwide Personal Tax and Immigration Guide 2017-18 (pp. 432-455). Retrieved from http://www.ey.com/gl/en/services/tax/global-tax-guide-archive
[11] EY. (2017). Worldwide VAT, GST and Sales Tax Guide 2017 (pp. 337-353). Retrieved from http://www.ey.com/gl/en/services/tax/global-tax-guide-archive
[12] Helms, L. J. (1965). The Effect of State and Local Taxes on Economic Growth: A Time Series Cross Section Approach, The Review of Economics and Statistics, 67, pp. 574-82.
[13] Kalaš, B., Mirović, V., Andrašić, J. (2017). Estimating the impact of taxes on the economic growth in the United States. Economic times, 55(4), pp. 481-499.
[14] Kwass, M. (2000). Privilege and the politics of taxation in eighteenth-century France - Liberté, égalité, fiscalité. Cambridge University Press.
[15] Nálepová, V., (2017). Affects corporate taxation economic growth? – Dynamic approach for OECD Countries. European Journal of Business Science and Technology, 3(2), pp. 132-147.
[16] Obreja, L., Brasoveanu, I. (2008). The Correlation between Fiscal Policy and Economic Growth, Theoretical and Applied Economics, 11(528), pp. 51-59.
[17] Romer, C., Romer, D. (2010). The Macroeconomic Effects of Tax Changes: Estimates Based on a New Measure of Fiscal Shocks. American Economic Review, 100(3), pp. 763-801.
[18] Thompson, W. R., Mattila, J. M. (1959). An Econometric Model of Postwar State Industrial Development. Wayne State University Press.
[19] Willis, H. P. (1895). Income taxation in France. Journal of Political Economy, 4(1), pp. 37-53 [20] http://stats.oecd.org/
